29,378 people live in 19130, where the median age is 33.5 and the average individual income is $67,927. Data provided by the U.S. Census Bureau.
Total Population
Median Age
Population Density Population Density This is the number of people per square mile in a neighborhood.
Average individual Income
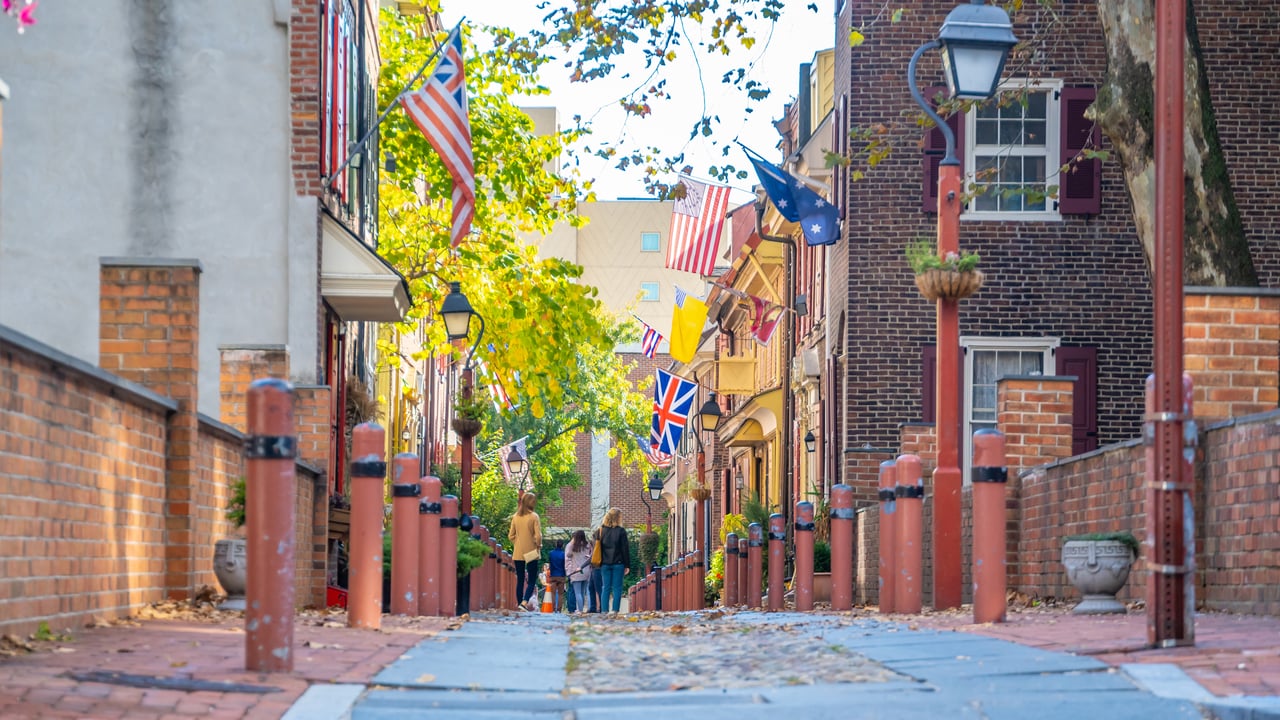
There's plenty to do around 19130, including shopping, dining, nightlife, parks, and more. Data provided by Walk Score and Yelp.
Explore popular things to do in the area, including ABV% Beverage, Cannuli Sausages, and Greenstreet Coffee.
| Name | Category | Distance | Reviews |
Ratings by
Yelp
|
|---|---|---|---|---|
| Dining · $ | 4.39 miles | 5 reviews | 5/5 stars | |
| Dining · $$ | 3.23 miles | 6 reviews | 5/5 stars | |
| Dining | 2.26 miles | 6 reviews | 5/5 stars | |
| Dining · $$ | 3 miles | 10 reviews | 5/5 stars | |
| Dining | 1.85 miles | 9 reviews | 5/5 stars | |
| Active | 0.71 miles | 16 reviews | 5/5 stars | |
| Active | 4.53 miles | 6 reviews | 5/5 stars | |
| Active | 1.54 miles | 20 reviews | 5/5 stars | |
| Active | 2.69 miles | 10 reviews | 5/5 stars | |
| Beauty | 2.64 miles | 5 reviews | 5/5 stars | |
| Beauty | 2.6 miles | 18 reviews | 5/5 stars | |
| Beauty | 1.92 miles | 5 reviews | 5/5 stars | |
| Beauty | 1.67 miles | 5 reviews | 5/5 stars | |
| Beauty | 3.94 miles | 6 reviews | 5/5 stars | |
| Beauty | 1.75 miles | 6 reviews | 5/5 stars | |
| Beauty | 1.32 miles | 15 reviews | 5/5 stars | |
| Beauty | 3.21 miles | 5 reviews | 5/5 stars | |
|
|
||||
|
|
||||
|
|
||||
|
|
||||
|
|
||||
|
|
19130 has 15,446 households, with an average household size of 1.85. Data provided by the U.S. Census Bureau. Here’s what the people living in 19130 do for work — and how long it takes them to get there. Data provided by the U.S. Census Bureau. 29,378 people call 19130 home. The population density is 23,740.22 and the largest age group is Data provided by the U.S. Census Bureau.
Total Population
Population Density Population Density This is the number of people per square mile in a neighborhood.
Median Age
Men vs Women
Population by Age Group
0-9 Years
10-17 Years
18-24 Years
25-64 Years
65-74 Years
75+ Years
Education Level
Total Households
Average Household Size
Average individual Income
Households with Children
With Children:
Without Children:
Marital Status
Blue vs White Collar Workers
Blue Collar:
White Collar:
Let my three decades of experience work in your favor. Reach out via phone or email today, and let's embark on the journey to finding your perfect place to call home!
Let's Connect